Case file
Patient timeline
One fictional admission on a timeline you can drag, zoom and scrub: observations, medicines, results and notes on one clock. Click any event and the chain of decisions behind it and after it is drawn across the lanes. Observation timing follows the NEWS2 rule, and the Sepsis Six timings are computed from the record. 90 tests. Not a medical device.
- Author
- Henry CartoMSc · Software, Medical & eHealth Engineer
- Role
- Design and engineering.
- Stack
- React · TypeScript · Vite · SVG · Vitest
- State
- Live, fictional patient.
Problem
A record answers "what is true now" well and "how did we get here" badly. That second question lives across five screens: the observation chart, the drug chart, the results viewer, the notes and the handover sheet. This interface puts observations, medicines, results and notes in lanes on one time axis that you can drag, zoom and scrub, and adds the one thing none of those screens stores, which is because.
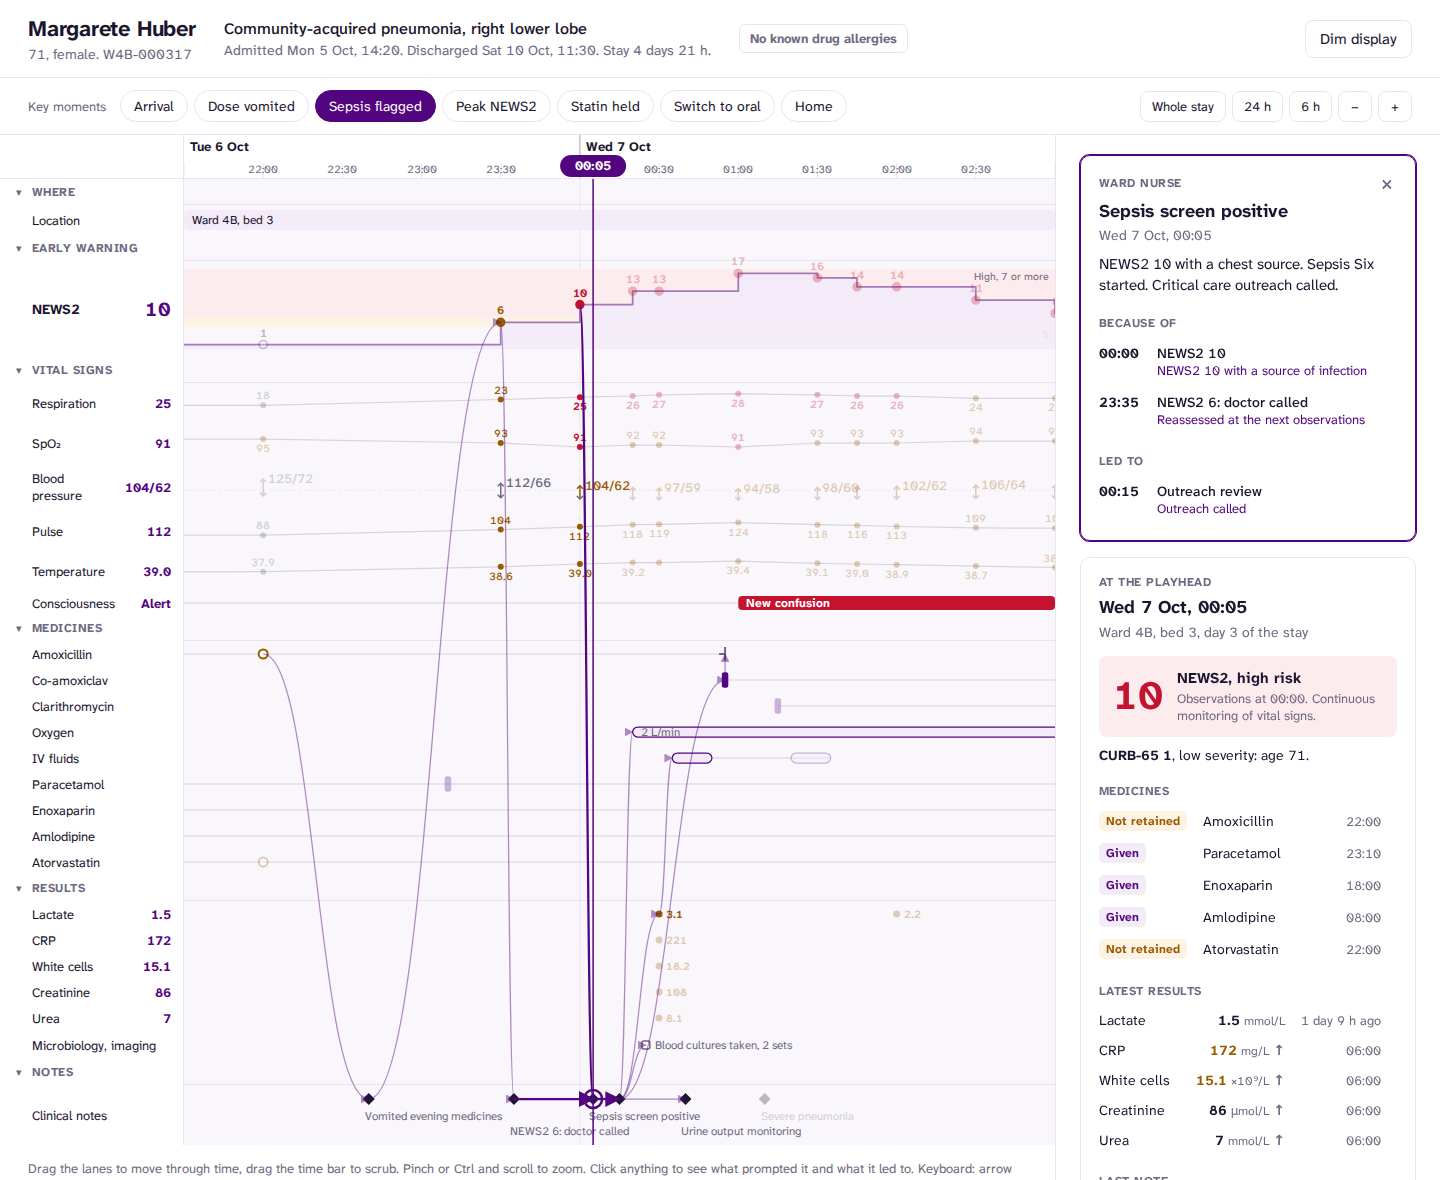
The night of the deterioration. The positive sepsis screen at 00:05 is selected, and the chain is drawn back to what prompted it and forward to what it led to. Everything outside the chain fades back.
Four decisions
Decision chains. Click the positive sepsis screen at 00:05. The chain is drawn back to the NEWS2 of 10 that triggered it, the NEWS2 of 6 half an hour earlier, the repeat observations ordered after she vomited, and the 22:00 amoxicillin dose she vomited. It is also drawn forward to outreach, oxygen, cultures, lactate, fluids and the first intravenous antibiotic. Everything outside the chain fades back.
A playhead, not a page. Drag the time bar and every lane reports its state at that minute: NEWS2 and the response it requires, CURB-65 with the criteria that count, which medicines are running, given, held or not retained, and the latest result of each test with its trend.
Semantic zoom. The whole stay shows the shape: the dense cluster of observations on the worst night, the intravenous to oral switch, the held doses. Zoom in and the values, labels and individual doses appear. Detail is chosen from minutes per pixel, so a phone and a wide screen show the same window the same way. Busy notes merge into a count that zooms in when clicked.
Response, measured. The Sepsis Six and its timings are computed from the record, not typed in. Oxygen came at 15 minutes, cultures at 20, lactate at 25, fluids at 30, urine output at 35 and antibiotics at 50. The panel also shows the time from the first NEWS2 of 5 or more to clinical review (45 minutes) and the time at high risk (5 hours).
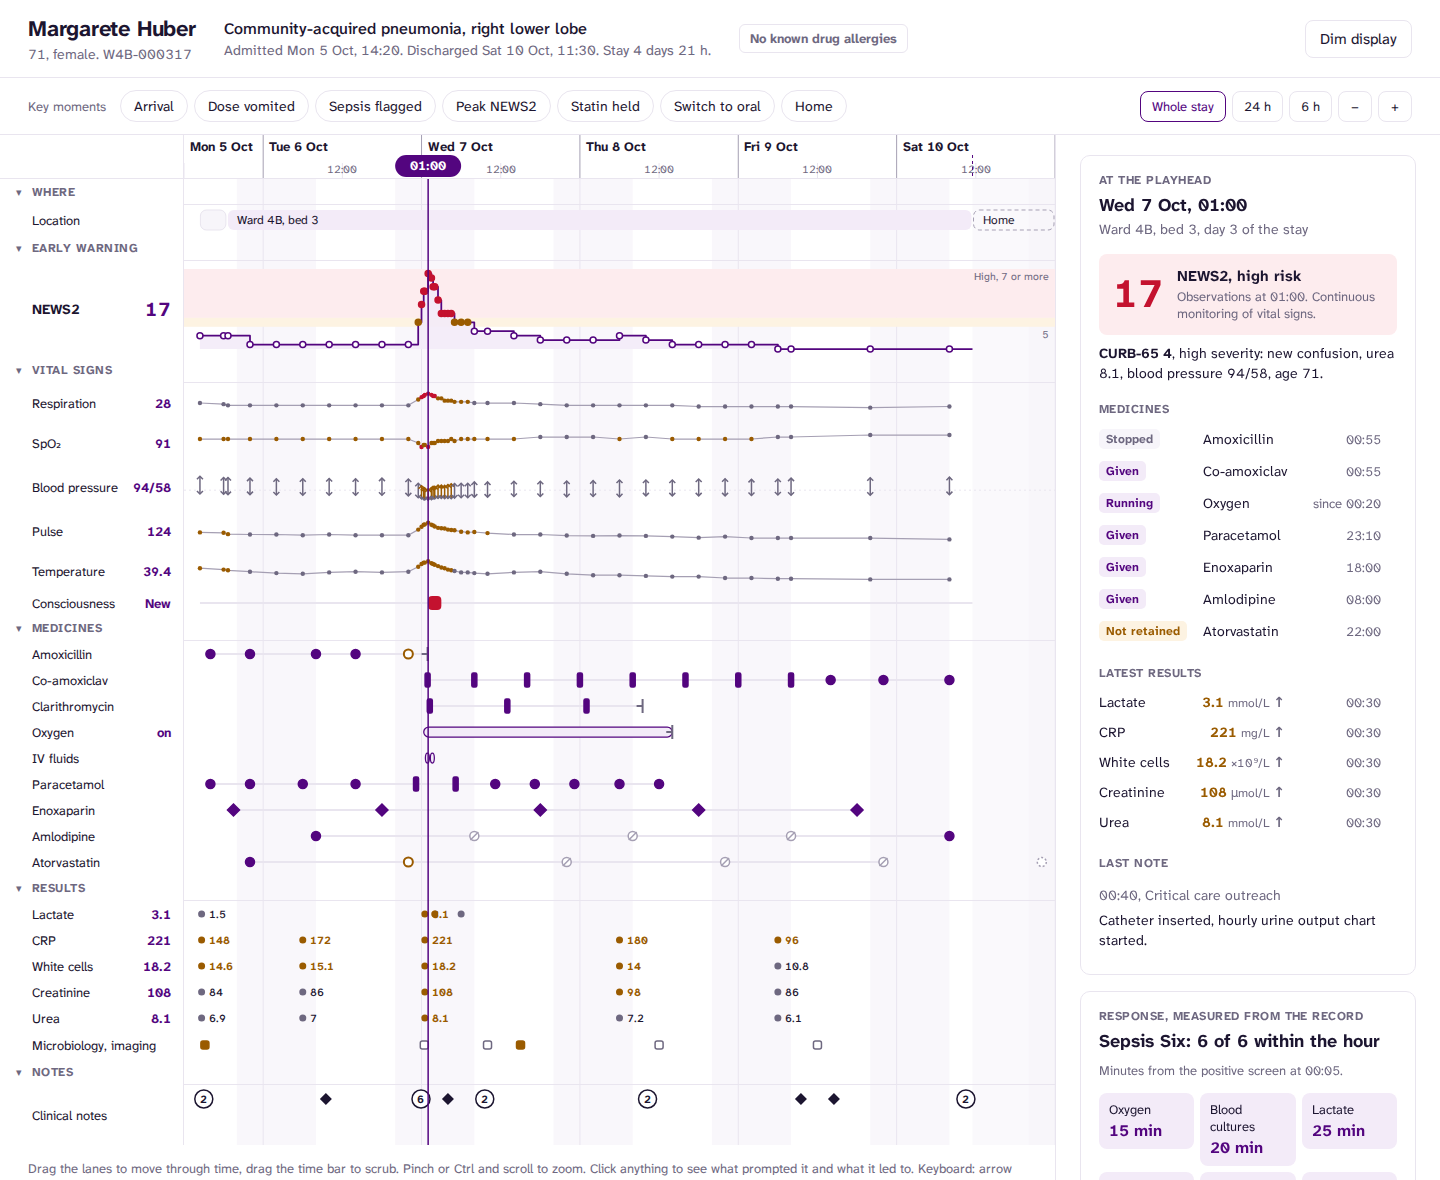
The whole stay. The dense cluster of observations on the worst night, the intravenous to oral switch and the held doses are visible before any value is.
The patient
Margarete Huber, 71, is fictional. She is Bed 3 in my Ward 4B monitor. The night she deteriorates uses the same vital-sign keyframes, and she reaches the same peak of NEWS2 17 at 01:00. Here the record goes on: the team responds and she goes home four days later.
The course is built to be clinically coherent, and the tests hold it to that:
- She is admitted with low-severity pneumonia (CURB-65 1, age) on oral amoxicillin and vomits the 22:00 dose on day 2. No antibiotic reaches her for nearly 11 hours, until the sepsis response.
- A pneumococcal urinary antigen comes back positive, so clarithromycin is stopped.
- The pharmacist holds atorvastatin because clarithromycin raises statin levels. It restarts 2 days after the last clarithromycin dose, which falls on the evening she goes home.
- Amlodipine is held while her blood pressure recovers.
- She switches from intravenous to oral antibiotics once she has had no fever for over 24 hours and her CRP is falling.
When observations were taken is not authored. It follows the NEWS2 rule for how often to observe at each score: every 12 hours at 0, every 4 hours at 1 to 4, hourly at 5 or 6 or with a single 3, and continuously at 7 or more (charted every 30 minutes). Sets fall on ward round times, and four extra sets were charted by a nurse for a reason written on the chart. The density of the chart on the worst night is the rule at work.
Clinical logic
NEWS2 is scored on both SpO₂ scales, with the band logic shared with the ward monitor. Each score carries the response it requires and how often to observe, and the observation schedule is that rule applied to the scores.
CURB-65 counts low blood pressure once and scores as CRB-65 when urea has not been measured. It is 1 in the emergency department and 4 at 01:10, matching the notes.
The state at any minute is computed from the record: which medicines are running, given, held, stopped or lapsed, CURB-65 with the criteria that count, and the latest result of each test with its trend. The Sepsis Six timings, the time at high risk and the time from the first NEWS2 of 5 or more to clinical review are computed the same way. Every decision link points at a real event and never runs backwards in time.
Tested
90 tests, including:
- NEWS2 band edges from both sides and both SpO₂ scales, shared with the ward monitor.
- CURB-65 at every threshold, counting low blood pressure once, and scoring as CRB-65 when urea has not been measured.
- The observation schedule never leaves a gap longer than the previous score allows.
- The vital signs match the ward monitor's Bed 3 keyframes minute for minute until the response.
- Every link points at a real event and never runs backwards in time. These tests caught two data errors while I built it.
- State at a moment: which medicines are running, given, held, stopped or lapsed, plus CURB-65 and the latest results.
- The Sepsis Six timings, time at high risk and time to review.
- Timeline geometry: zoom about the pointer, panning stops at the edges, tick spacing, level of detail, clustering and lane layout with collapsed groups.
Design
Same design system as the ward monitor. White with one purple for interaction. Amber and red appear only where a clinical rule puts them: the NEWS2 bands, each vital sign coloured by the points it scores, results outside their reference range, a dose not retained. The typeface is Atkinson Hyperlegible Next, bundled with the app so it works on hospital networks that block font hosts. Dim display follows the system or the button.
Lanes. Where the patient was, NEWS2 as a step line over its thresholds, six vital signs (blood pressure drawn as systolic and diastolic bars), nine medicines, five blood tests, microbiology and imaging, and clinical notes. Nights are shaded, and each group collapses to its header.
Doses are drawn by route: oral as a dot, intravenous as a bar, subcutaneous as a diamond. Fill shows status: given, held, not retained or planned.
Input. Drag the lanes to pan, drag the time bar to scrub, pinch or Ctrl and scroll to
zoom. The arrow keys step through events, + and − zoom, 0 shows the whole stay and Esc
clears the selection. Links such as ?at=wed-01:05 and ?event=sepsis open at a moment.
Phone. The same lanes with a narrower label column, and the panel below.
Not a medical device
A fictional patient and a simulated record, for demonstrating interface design and clinical logic. It is not validated for clinical use and must not be used to make clinical decisions.